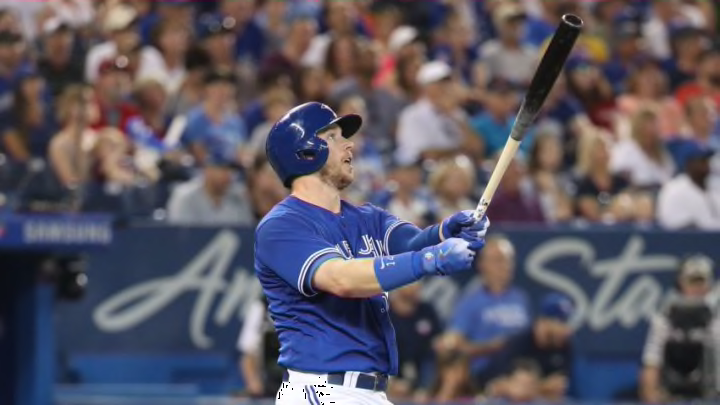
Blue Jays: Justin Smoak Gets in Your Ayes
By Bob Ritchie

The 2018 All Star Game marks the unofficial mid-point of the Major League Baseball season. This break in the regular season affords writers in search of content an opportunity to prepare some mid-season report cards.
One of the questions leading into the 2018 season was as follows: would Justin Smoak repeat his break-out 2017 season? I cast my vote with the ayes. Smoak has continued to excel as a Major League first baseman.
Unless otherwise noted, all data was sourced from FanGraphs. The rankings are for Major League Baseball (“MLB”) first basemen that meet the minimum qualified threshold mark (plate appearances and innings as determined by FanGraphs). Any 2018 data reflects games up to and including the games of July 15.
Was 2017 Smoak a fluke?
Smoak has continued to perform well in 2018. His wRC+ and wOBA are very close to his 2017 season marks. In terms of rankings among MLB first basemen, Smoak has improved upon last season’s achievement. I would argue that defensively he is close to his 2017 performance level.
I suppose one could reasonably opine that Smoak’s overall level of play has deteriorated (an extrapolated fWAR of 2.5 in 2018 compared to 2017’s 3.5) but it is negligible. It should be noted that Smoak’s 2018 2.2 bWAR to date compares favourably with his 2017 3.2 bWAR. The BABIP numbers show that his 2018 offensive prowess vis-a-vis 2017 is not BABIP-fueled.
Table 1 – Key Justin Smoak Data
So far I think Smoak will be happy to show his parents his mid-season report card. However, let’s take a closer look at his performance at the plate.
More from Jays Journal
- Matt Chapman has been exactly what the Blue Jays needed
- Blue Jays: The goalposts are moving in the right direction
- Single-A Dunedin Blue Jays advance to the Championship Series
- Blue Jays: Comparisons for Alek Manoah’s Second Season
- Blue Jays: Adam Cimber, the unlikely decision King
Additional batting data
Smoak’s plate appearances and batted ball profile has been summarized in Table 2. His 2018 strikeout and ground ball percentages are very similar to his career marks for those two metrics. Smoak’s walk rate is better than it was in 2017. This is possibly due, in part, to weaker bats surrounding him in the lineup (i.e., he is being pitched to more carefully). However, as will be shown in the next section, Smoak has improved his plate discipline from previous seasons. This could also explain his heightened walk rate.
Smoak’s 2018 LD% is lower than it was in 2017; his GB% is higher this season than last. This may indicate a decline in performance but I think it may be a change in objectives. Per Table 3, Smoak’s exit velocity (mph) and hard hit % is similar to 2017. Accordingly, Smoak may simply be trying to elevate the ball more than he has in the past. This has resulted in a higher GB% (hitting over the top of the ball) and FB% compared to 2017.
Table 2 – Additional Batting Data
Table 3 – Statcast Data
Source: Statcast
The 2018 report card is looking like it could be a repeat of 2017. Let’s take a peek at his batting approach.
Plate discipline
One of the things that was notable about Smoak’s 2017 season was how disciplined he was at the plate compared to his first years with the Blue Jays. For example, in 2016 he swung at almost 30% of balls out of the strike zone. As Table 4 illustrates, Smoak has improved upon the plate discipline that he exhibited in 2017.
Table 4– Plate Discipline
For the 2018 season to date, Smoak is swinging less at pitches than he had in 2017 and in his career to date (Swing%). That is reflected in both swings at balls out of the strike zone (O-Swing%) and in the strike zone (Z-Swing%). Compared to other American League first basemen, Smoak has the lowest O-Swing%; he was 3rd in 2017. This data demonstrates that Smoak’s new found plate discipline in 2017 was no fluke.
Smoak report card time
Let’s first establish a benchmark for purposes of assigning grades. In Table 5 below, I have created a scale using FanGraphs fWAR chart as a starting point. To be clear, my scale is not solely based on fWAR but it serves as a guideline.
Table 5 – Grade Chart
Smoak’s 2018 performance to date is very much a repeat of his break-out 2017 season. His offensive and defensive contribution is extremely close to his achievement of last season. My grade for Smoak’s 2017 season would be a B. This is based upon his fWAR as well as his ranking in other key metrics (wRC+, DRS, and UZR/150). Using the same criteria, Smoak’s 2018 pre-All Star break deserves a B minus, at a minimum.
Next: Could Ryan Merritt be worth a gamble?
The last word
One of the question marks for the Blue Jays as they entered the 2018 season was which Justin Smoak would show up. Was it the pre-2017 marginal player or the 2017 model? Well, so far in 2018 Smoak has performed well. He has largely replicated his 2017 season. Let’s hope that he can maintain this level as the remainder of the 2018 season unfolds.